顯示具有 __Quantum Computing 標籤的文章。 顯示所有文章

2023年4月8日 星期六

Python 量子運算(目錄)

Python 量子運算(目錄)

2022/01/22

-----

Qiskit https://qiskit.org/textbook/preface.html

%%pycodestyle

http://hilite.me/

-----

Quantum Note

-----

Python 量子運算(A):參考書目

Python 量子運算(B):精華資料

Python 量子運算(C):安裝元件


第一步:量子位元

Python 量子運算(一):量子電路

Python 量子運算(二):量子位元符號

Python 量子運算(三):量子位元基底

Python 量子運算(四):北極與南極

Python 量子運算(五):布洛赫球面

Python 量子運算(六):角度與弧度

Python 量子運算(七):球面上的量子位元

Python 量子運算(八):球面上的線性組合

Python 量子運算(九):半角

Python 量子運算(一0):投影

Python 量子運算(一一):歐拉公式

Python 量子運算(一二):括量與包量

Python 量子運算(一三):狄拉克標記

Python 量子運算(一四):點積

Python 量子運算(一五):內積

Python 量子運算(一六):和角

Python 量子運算(一七):差角

Python 量子運算(一八):和差角公式

Python 量子運算(一九):叉積

Python 量子運算(二0):叉積範例

Python 量子運算(二一):張量

Python 量子運算(二二):克羅內克積

Python 量子運算(二三):外積

Python 量子運算(二四):張量積

Python 量子運算(二五):積

Python 量子運算(二六):機率幅

Python 量子運算(二七):三維直角坐標系

Python 量子運算(二八):投影算子

Python 量子運算(二九):兩極與赤道

Python 量子運算(三0):直角坐標系與和角


第二步:量子暫存器

Python 量子運算(三一):量子暫存器


Python 量子運算(三一點二):富爸

Python 量子運算(三一點三):底線

Python 量子運算(三一點四):槽(Slot)

Python 量子運算(三一點五):裝飾器

Python 量子運算(三一點六):裝飾器實例

Python 量子運算(三一點七):無(None)

Python 量子運算(三一點八):(raise)

Python 量子運算(三一點九):規範(Style)


第三步:


0. Prerequisites

0.1 Setting Up Your Environment

0.2 Python and Jupyter Notebooks


1. Quantum States and Qubits

1.1 Introduction

1.2 The Atoms of Computation

1.3 Representing Qubit States

1.4 Single Qubit Gates

1.41 X

Y

Z

1.42 H

1.43 M

P

I

S

T

U

1.5 The Case for Quantum


2. Multiple Qubits and Entanglement

2.1 Introduction

2.2 Multiple Qubits and Entangled States

2.21 CNOT

2.3 Phase Kickback

2.4 More Circuit Identities

2.5 Proving Universality

2.6 Classical Computation on a Quantum Computer


3. Quantum Protocols and Quantum Algorithms

3.1 Defining Quantum Circuits

3.2 Deutsch-Jozsa Algorithm

3.3 Bernstein-Vazirani Algorithm

3.4 Simon's Algorithm

3.5 Quantum Fourier Transform

3.6 Quantum Phase Estimation

3.7 Shor's Algorithm

3.8 Grover's Algorithm


附錄:量子力學簡介

量子力學簡介(一):核心五人

量子力學簡介(二):前後五人

量子力學簡介(三):楊氏雙狹縫實驗

量子力學簡介(四):電子雙狹縫實驗

量子力學簡介(五):磁矩

量子力學簡介(六):斯特恩-革拉赫實驗

量子力學簡介(七):量子力學公設

量子力學簡介(八):EPR 悖論與貝爾不等式

-----


https://pixabay.com/zh/photos/censorship-limitations-610101/

-----

舊版草稿

-----

Python 量子運算(目錄)

https://mandhistory.blogspot.com/2022/01/quantum-computing.html

-----

2023年4月4日 星期二

1.4 Single Qubit Gates

1.4 Single Qubit Gates

2023/04/04

-----

References


[1] Single Qubit Gates

https://qiskit.org/textbook/ch-states/single-qubit-gates.html

-----

2023年4月3日 星期一

1.2 The Atoms of Computation

1.2 The Atoms of Computation

2023/04/03

-----

References


[1] The Atoms of Computation

https://qiskit.org/textbook/ch-states/atoms-computation.html


[2] Label logic gates after using logicparse in Schemdraw library in Python - Stack Overflow

https://stackoverflow.com/questions/68581950/label-logic-gates-after-using-logicparse-in-schemdraw-library-in-python


[3] Digital Logic — Schemdraw 0.16 documentation

https://schemdraw.readthedocs.io/en/latest/elements/logic.html


[4] 快速入門SchemDraw繪製電路圖- 知乎

https://zhuanlan.zhihu.com/p/460816198

-----

Python 量子運算(目錄)

https://mandhistory.blogspot.com/2022/01/quantum-computing.html

-----

2.2 Multiple Qubits and Entangled States

2.2 Multiple Qubits and Entangled States

2023/04/03

-----

References


[1] Multiple Qubits and Entangled States

https://qiskit.org/textbook/ch-gates/multiple-qubits-entangled-states.html

-----

Python 量子運算(目錄)

https://mandhistory.blogspot.com/2022/01/quantum-computing.html

-----

2.3 Phase Kickback

2.3 Phase Kickback

 二點三 Phase Kickback

2023/03/30

-----

References


[1] Phase Kickback

https://qiskit.org/textbook/ch-gates/phase-kickback.html


[2] Phase kickback

https://nosarthur.github.io/quantum%20information%20and%20computation/2018/01/26/kickback.html


[3] 一個聰明的量子戲法——相位反衝,告訴你如何進行量子計算 - 每日頭條

https://kknews.cc/zh-tw/news/bv46kk6.html


[4] Introduction to Quantum Computing 4: Phase Kickback - YouTube

https://www.youtube.com/watch?v=b7cbrOnkG0Y

-----

Python 量子運算(目錄)

https://mandhistory.blogspot.com/2022/01/quantum-computing.html

-----

3.2 Deutsch-Jozsa Algorithm

3.2 Deutsch-Jozsa Algorithm

三點二 多伊奇.喬薩演算法

2023/03/21

-----

References


[1] Deutsch-Jozsa Algorithm

https://qiskit.org/textbook/ch-algorithms/deutsch-jozsa.html


[2] mod03lec15 - Quantum Algorithms: Deutsch Jozsa Algorithm - YouTube

https://www.youtube.com/watch?v=x3DDKrM4ZGs


[3] Deutsch Jozsa Algorithm - YouTube

https://www.youtube.com/watch?v=mGqyzZ-fnnY


[4] Introduction to quantum computing: The Deutsch algorithm. — Anastasios Kyrillidis

https://akyrillidis.github.io/notes/quant_post_8

-----

2023年3月21日 星期二

Python 量子運算(三一點六):裝飾器實例

Python 量子運算(三一點六):裝飾器實例

2023/03/15

-----

References


[1] python @classmethod 的使用场合 - 知乎

https://zhuanlan.zhihu.com/p/35643573


[2] Python classmethod()

https://www.programiz.com/python-programming/methods/built-in/classmethod


[3] 正確理解Python中的@staticmethod@classmethod方法- 知乎

https://zhuanlan.zhihu.com/p/28010894


[4] [Python教學] Class / Static /Abstract Method 初探 - Max行銷誌

https://www.maxlist.xyz/2019/12/08/python-class-static-abstract-method/


[5] python @property的介紹與使用- 知乎

https://zhuanlan.zhihu.com/p/64487092


[6] Getters and Setters: Manage Attributes in Python – Real Python

https://realpython.com/python-getter-setter/


[7] Getter and Setter in Python - GeeksforGeeks

https://www.geeksforgeeks.org/getter-and-setter-in-python/


[8] Python 装饰器之 Property: Setter 和 Getter | A Quest After Perspectives

https://iphysresearch.github.io/blog/post/programing/python/property_setter/

-----

Python 量子運算(目錄)

https://mandhistory.blogspot.com/2022/01/quantum-computing.html

-----

Python 量子運算(三一點五):裝飾器

Python 量子運算(三一點五):裝飾器

2023/03/13

-----

References


[1] Decorators in Python - GeeksforGeeks

https://www.geeksforgeeks.org/decorators-in-python/


[2] Python Decorators: A Complete Guide - GeeksforGeeks

https://www.geeksforgeeks.org/python-decorators-a-complete-guide/


[3] Python Decorators (With Examples)

https://www.programiz.com/python-programming/decorator

-----

Python 量子運算(目錄)

https://mandhistory.blogspot.com/2022/01/quantum-computing.html

-----

Python 量子運算(三一點四):槽(Slot)

Python 量子運算(三一點四):槽(Slot)

2023/03/16

-----

References


[1] 如何理解和使用python里的__slots__? - 知乎

https://zhuanlan.zhihu.com/p/101109893

-----

Python 量子運算(目錄)

https://mandhistory.blogspot.com/2022/01/quantum-computing.html

-----

Python 量子運算(三一點三):底線

Python 量子運算(三一點三):底線

2023/03/07

-----

References


[1] The Meaning of Underscores in Python – dbader.org

https://dbader.org/blog/meaning-of-underscores-in-python


# 底線

[2] Branding 品牌行銷術: [English Skills] 進階英文 - 天啊!符號們怎麼唸啊?(下)

http://chipersonalbranding.blogspot.com/2018/04/english-skills.html


[3] Python 寫程式的「底線」:7 種使用技巧 • 好豪筆記

https://haosquare.com/python-underscore/


[4] Python中的underscore _ 與 __ 及實例剖析. __ 或是 _,在python code中常常看到,在class命名中寫成… | by Ching | bits-to-blocks | Medium

https://medium.com/bits-to-blocks/python%E4%B8%AD%E7%9A%84underscore-%E8%88%87-9b40caf32483


[5] Python,你到底是在__底線__什麼啦! | 宅吉便

https://aji.tw/2017/06/python%E4%BD%A0%E5%88%B0%E5%BA%95%E6%98%AF%E5%9C%A8__%E5%BA%95%E7%B7%9A__%E4%BB%80%E9%BA%BC%E5%95%A6/


[6] Role of Underscores '_' in Python - GeeksforGeeks

https://www.geeksforgeeks.org/role-of-underscores-_-in-python/


[7] Underscore (_) in Python - GeeksforGeeks

https://www.geeksforgeeks.org/underscore-_-python/


[8] Underscores, dunders and everything nice

https://www.hacksoft.io/blog/underscores-dunders-and-everything-nice


[9] Underscore in Python Tutorial : What is the purpose and meaning of _ & __ | DataCamp

https://www.datacamp.com/tutorial/role-underscore-python


[10] python - What is the meaning of single and double underscore before an object name? - Stack Overflow

https://stackoverflow.com/questions/1301346/what-is-the-meaning-of-single-and-double-underscore-before-an-object-name

-----

Python 量子運算(目錄)

https://mandhistory.blogspot.com/2022/01/quantum-computing.html

-----

Python 量子運算(三一點二):富爸

Python 量子運算(三一點二):富爸

2023/03/08

-----

References


[1] Foobar - Wikipedia

https://en.wikipedia.org/wiki/Foobar


[2] foo到底是什麼意思? - 知乎

https://www.zhihu.com/question/34512213


[3] 資訊工程入門: "Foo"的由來

http://easy-intro-world1.blogspot.com/2011/07/foo.html

-----

Python 量子運算(目錄)

https://mandhistory.blogspot.com/2022/01/quantum-computing.html

-----

Python 量子運算(三一):量子暫存器

Python 量子運算(三一):量子暫存器

2023/02/28

-----

「在電路圖中,每個實線都代表一個量子位元,或者更廣泛地說,都代表一個量子位元暫存器。 依照慣例,頂端的線路是量子位元暫存器 0,其餘線路則會依序標示。」[4]。

-----

References


[1] QuantumCircuit — Qiskit 0.19.6 documentation

https://qiskit.org/documentation/stable/0.19/stubs/qiskit.circuit.QuantumCircuit.html


[2] QuantumRegister

https://qiskit.org/documentation/stubs/qiskit.circuit.QuantumRegister.html


[3] ClassicalRegister

https://qiskit.org/documentation/stubs/qiskit.circuit.ClassicalRegister.html


[4] 量子電路圖 - Azure Quantum | Microsoft Learn

https://learn.microsoft.com/zh-tw/azure/quantum/concepts-circuits

-----

Python 量子運算(目錄)

https://mandhistory.blogspot.com/2022/01/quantum-computing.html

-----

2023年3月14日 星期二

Python 量子運算(A):參考書目

Python 量子運算(A):參考書目

2022/12/31

說明:


-----


https://pixabay.com/zh/photos/censorship-limitations-610101/

-----

一、英文 Python 書籍

二、中文 Python 書籍

三、英文量子運算書籍

四、中文量子運算書籍

五、中文量子力學書籍

-----

一、英文 Python 書籍(網頁)


# 網頁

◎ Python Courses and Tutorials: Online and On Site

https://python-course.eu/


# 網頁

◎ Numerical Programming with Python | Numerical Programming

https://python-course.eu/numerical-programming/


# 網頁

◎ Intro to Machine Learning with Python | Machine Learning

https://python-course.eu/machine-learning/


# 書

◎ A Whirlwind Tour of Python | A Whirlwind Tour of Python

https://jakevdp.github.io/WhirlwindTourOfPython/


# 書

◎ Python Data Science Handbook | Python Data Science Handbook

https://jakevdp.github.io/PythonDataScienceHandbook/

-----

二、中文 Python 書籍


# Python 

◎ 博客來-必學!Python 資料科學‧機器學習最強套件:NumPy、Pandas、Matplotlib、OpenCV、scikit-learn、tf.Keras

https://www.books.com.tw/products/0010888154


# Pandas 

◎ 博客來-Pandas資料分析實戰:使用Python進行高效能資料處理及分析

https://www.books.com.tw/products/0010831896


# Scikit-learn 

◎ 博客來-Python機器學習(第二版)

https://www.books.com.tw/products/0010797010


Python 神乎其技 全新超譯版 - 快速精通 Python 進階功能, 寫出 Pythonic 的程式 (Python Tricks: A Buffet of Awesome Python Features) | 天瓏網路書店

https://www.tenlong.com.tw/products/9789863122869

-----

三、英文量子運算書籍


◎ Quantum Computation and Quantum Information

https://www.amazon.com/Quantum-Computation-Information-10th-Anniversary/dp/1107002176


◎ Principles of Quantum Computation and Information

https://www.amazon.com/Principles-Quantum-Computation-Information-Comprehensive/dp/9813237228


◎ Quantum Computing: A Gentle Introduction

https://www.amazon.com/Quantum-Computing-Introduction-Engineering-Computation/dp/0262526670


◎ Practical Quantum Computing for Developers

https://www.amazon.com/Practical-Quantum-Computing-Developers-Programming/dp/1484242173

-----

四、中文量子運算書籍


# qiskit

◎ 輕鬆學量子程式設計

https://staff.csie.ncu.edu.tw/jrjiang/qbook/


# qiskit

◎ 博客來-量子電腦應用與世界級競賽實務-社會用書(一品)

https://www.books.com.tw/products/0010909769

-----

五、中文量子力學書籍


◎ 博客來-給孩子講量子力學

https://www.books.com.tw/products/CN11408600


◎ 《量子力學導論》ISBN:9576940923│凡異│曾謹言 | 露天市集 | 全台最大的網路購物市集

https://www.ruten.com.tw/item/show?21846992906455


◎ 博客來-量子論縱覽:從量子論的基本概念到量子電腦 人人伽利略12

https://www.books.com.tw/products/0010861265


◎ 博客來-史上最好懂 量子物理史話:上帝擲骰子嗎?

https://www.books.com.tw/products/0010813432


◎ 博客來-費曼物理學講義 III:量子力學(共3冊,平裝版)

https://www.books.com.tw/products/0010786553


# 楊氏雙狹縫實驗

# 電子雙狹縫實驗

◎ 博客來-如何幫地球量體重

https://www.books.com.tw/products/0010352799

-----

Python 量子運算(目錄)

https://mandhistory.blogspot.com/2022/01/quantum-computing.html

-----

2023年2月26日 星期日

Python 量子運算(三0):直角坐標系與和角

Python 量子運算(三0):直角坐標系與和角

2023/02/26

-----


Fig. 30.1. Cartesian coordinate system and angle sum.

-----

  1
  2
  3
  4
  5
  6
  7
  8
  9
 10
 11
 12
 13
 14
 15
 16
 17
 18
 19
 20
 21
 22
 23
 24
 25
 26
 27
 28
 29
 30
 31
 32
 33
 34
 35
 36
 37
 38
 39
 40
 41
 42
 43
 44
 45
 46
 47
 48
 49
 50
 51
 52
 53
 54
 55
 56
 57
 58
 59
 60
 61
 62
 63
 64
 65
 66
 67
 68
 69
 70
 71
 72
 73
 74
 75
 76
 77
 78
 79
 80
 81
 82
 83
 84
 85
 86
 87
 88
 89
 90
 91
 92
 93
 94
 95
 96
 97
 98
 99
100
101
102
103
104
105
106
107
108
109
110
111
112
113
114
115
116
117
118
119
120
121
122
123
124
125
126
127
128
129
130
131
132
# Program 30.1:Cartesian coordinate system and angle sum
import matplotlib as mpl
import matplotlib.pyplot as plt

from qiskit.visualization import plot_bloch_vector


def Subplot_1():
    ax = plt.subplot(221)

    s1 = (
        r'$\vert 0 \rangle \equiv $'
        r'$\begin{bmatrix} 1 \\ 0 \end{bmatrix} \mapsto (0,0,1)$'
    )

    s2 = (
        r'$\vert 1 \rangle \equiv $'
        r'$\begin{bmatrix} 0 \\ 1 \end{bmatrix} \mapsto (0,0,-1)$'
    )

    s3 = r'$\psi_x=\cos \phi \sin \theta$'
    s4 = r'$\psi_y=\sin \phi \sin \theta$'
    s5 = r'$\psi_z=\cos \theta$'

    ax.text(0.15, 0.90, s1)
    ax.text(0.15, 0.60, s2)
    ax.text(0.15, 0.30, s3, color='r')
    ax.text(0.15, 0.20, s4, color='r')
    ax.text(0.15, 0.10, s5, color='r')

    ax.text(0.5, -0.055, '(a)', fontsize=20)
    ax.set_axis_off()

    return


def Subplot_2():
    ax = plt.subplot(222)

    # string setting
    s1_1 = r'$\sin(\alpha+\beta)$'
    s1_2 = r'$=\sin\alpha\cos\beta+\cos\alpha\sin\beta$'
    s1_3 = r'$\sin \theta = 2 \sin \frac{\theta}{2} \cos \frac{\theta}{2}$'

    s2_1 = r'$\cos(\alpha+\beta)$'
    s2_2 = r'$=\cos\alpha\cos\beta-\sin\alpha\sin\beta$'
    s2_3 = r'$\cos \theta = \cos^2 \frac{\theta}{2} - \sin^2 \frac{\theta}{2}$'

    # string output
    ax.text(0.10, 0.95, s1_1)
    ax.text(0.20, 0.80, s1_2)
    ax.text(0.10, 0.65, s1_3, color='r')

    ax.text(0.20, 0.45, s2_1)
    ax.text(0.10, 0.30, s2_2)
    ax.text(0.10, 0.15, s2_3, color='r')

    ax.text(0.5, -0.055, '(b)', fontsize=20)
    ax.set_axis_off()

    return


def Subplot_3():
    ax = plt.subplot(223)

    # string setting
    s1_1 = r'$\vert\psi\rangle$'

    s1_2 = (
        r'$=\cos\frac{\theta}{2}\ \vert0\rangle'
        r'+e^{i\phi}\sin\frac{\theta}{2}\ \vert1\rangle$'
    )

    s2 = (
        r'$=\begin{bmatrix}\cos\frac{\theta}{2}\\$'
        r'$\ e^{i\phi}\sin\frac{\theta}{2}\ \end{bmatrix}$'
    )

    s3 = r'$(0\leq\theta\leq\pi,\ 0\leq\phi<2\pi)$'

    # string output
    ax.text(0.10, 0.75, s1_1)
    ax.text(0.25, 0.75, s1_2)
    ax.text(0.25, 0.45, s2)
    ax.text(0.10, 0.15, s3)

    ax.text(0.5, -0.055, '(c)', fontsize=20)
    ax.set_axis_off()

    return


def Subplot_4():
    ax = plt.subplot(224)

    # string setting
    s1 = r'$1 = \cos^2 \frac{\theta}{2} + \sin^2 \frac{\theta}{2}$'
    s2 = r'$e ^{i\phi} = \cos \phi + i \sin \phi$'

    s3 = (
        r'$\vert \psi \rangle =\ $'
        r'$\begin{bmatrix}$'
        r'$\sqrt \frac{1+\psi_z}{2} \\$'
        r'$\frac{\psi_x+i\psi_y}{\sqrt{2(1+\psi_z)}}$'
        r'$\end{bmatrix}$'
    )

    # string output
    ax.text(0.10, 0.95, s1, color='r')
    ax.text(0.10, 0.85, s2, color='r')
    ax.text(0.10, 0.35, s3, color='r', fontsize=70)

    ax.text(0.5, -0.055, '(d)', fontsize=20)
    ax.set_axis_off()

    return


# figure setting
mpl.rcParams['text.usetex'] = True
mpl.rcParams['text.latex.preamble'] = r'\usepackage{{amsmath}}'
mpl.rcParams['font.size'] = 40
fig, ax = plt.subplots(figsize=(16, 16))

Subplot_1()
Subplot_2()
Subplot_3()
Subplot_4()

# plt.savefig('/content/drive/My Drive/pqc/0030_001.png', facecolor='w')
plt.show()

-----

References


-----

Python 量子運算(目錄)

https://mandhistory.blogspot.com/2022/01/quantum-computing.html

-----

2023年2月25日 星期六

Python 量子運算(二九):兩極與赤道

Python 量子運算(二九):兩極與赤道

2023/02/25

-----


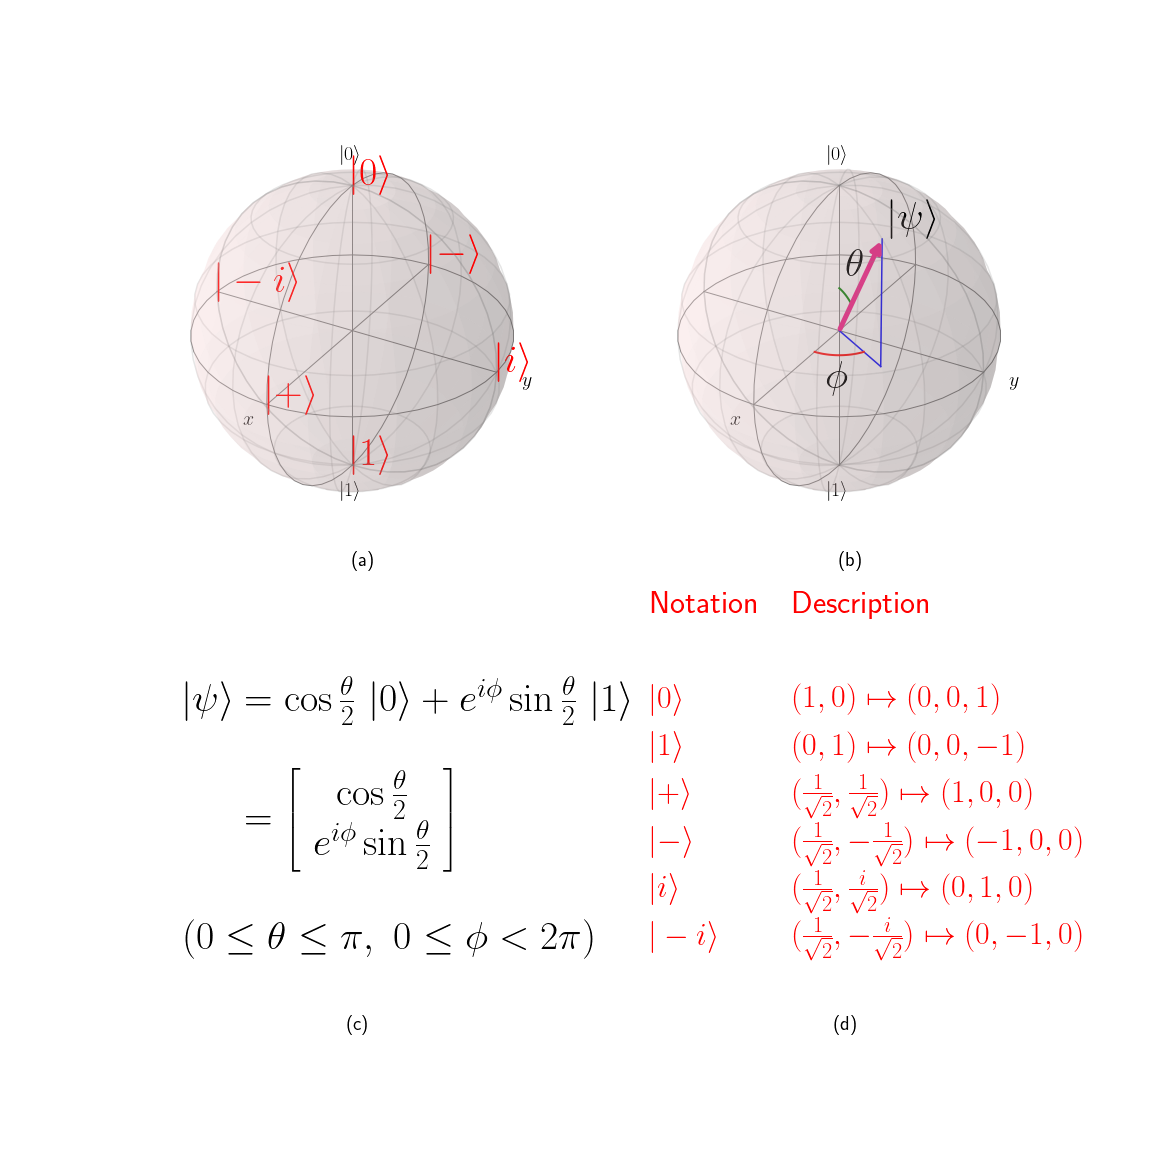
Fig. 29.1. Two poles and equator.

-----

代碼 29.1


  1
  2
  3
  4
  5
  6
  7
  8
  9
 10
 11
 12
 13
 14
 15
 16
 17
 18
 19
 20
 21
 22
 23
 24
 25
 26
 27
 28
 29
 30
 31
 32
 33
 34
 35
 36
 37
 38
 39
 40
 41
 42
 43
 44
 45
 46
 47
 48
 49
 50
 51
 52
 53
 54
 55
 56
 57
 58
 59
 60
 61
 62
 63
 64
 65
 66
 67
 68
 69
 70
 71
 72
 73
 74
 75
 76
 77
 78
 79
 80
 81
 82
 83
 84
 85
 86
 87
 88
 89
 90
 91
 92
 93
 94
 95
 96
 97
 98
 99
100
101
102
103
104
105
106
107
108
109
110
111
112
113
114
115
116
117
118
119
120
121
122
123
124
125
126
127
128
129
130
131
132
133
134
135
136
137
138
139
140
141
142
143
144
145
146
147
148
149
150
151
152
153
154
155
156
157
158
159
160
161
162
163
164
165
166
167
168
169
170
171
172
173
174
175
176
177
178
179
180
181
# Program 29.1:Two poles and equator
import numpy as np
import matplotlib as mpl
import matplotlib.pyplot as plt

from qiskit.visualization import plot_bloch_vector


class Point:
    def __init__(self, x, y, z):
        self.x = x
        self.y = y
        self.z = z


def Line(ax, A, B):
    ax.plot([A.x, B.x], [A.y, B.y], [A.z, B.z], 'b')
    return


def Subplot_1():
    ax1 = fig.add_subplot(221, projection='3d')

    PO = Point(0, 0, 0)
    plot_bloch_vector([PO.x, PO.y, PO.z], ax=ax1)

    P1 = Point(0, 0, 1)
    P2 = Point(0, 0, -1)
    P3 = Point(0, -1, 0)
    P4 = Point(0, 1, 0)
    P5 = Point(1, 0, 0)
    P6 = Point(-1, 0, 0)

    ax1.text(P1.x, P1.y, P1.z, r'$\vert 0 \rangle$', color='r')
    ax1.text(P2.x, P2.y, P2.z, r'$\vert 1 \rangle$', color='r')
    ax1.text(P3.x, P3.y, P3.z, r'$\vert + \rangle$', color='r')
    ax1.text(P4.x, P4.y, P4.z, r'$\vert - \rangle$', color='r')
    ax1.text(P5.x, P5.y, P5.z, r'$\vert i \rangle$', color='r')
    ax1.text(P6.x, P6.y, P6.z, r'$\vert -i \rangle$', color='r')

    ax1.text(0, 0, -1.8, '(a)', fontsize=20)
    ax.set_axis_off()

    return


def Subplot_2():
    ax1 = fig.add_subplot(222, projection='3d')

    # P1 = Point(0, 0, 1)
    # plot_bloch_vector([P1.x, P1.y, P1.z], ax=ax1)
    # ax1.scatter(P1.x, P1.y, P1.z)

    # P2 = Point(0, 0, 0)
    # Line(ax1, P1, P2)

    theta = np.pi / 6
    rotation = (3/2) * np.pi  # transfer 3d to qiskit 3d
    phi_1 = np.pi / 3         # 3d
    phi_2 = rotation + phi_1  # qiskit 3d

    PO = Point(0, 0, 0)
    PB_1 = Point(np.sin(theta)*np.cos(phi_1), np.sin(theta)*np.sin(phi_1), 0)
    PB_2 = Point(np.sin(theta)*np.cos(phi_2), np.sin(theta)*np.sin(phi_2), 0)
    PA_1 = Point(PB_1.x, PB_1.y, np.cos(theta))
    PA_2 = Point(PB_2.x, PB_2.y, np.cos(theta))

    plot_bloch_vector([PA_1.x, PA_1.y, PA_1.z], ax=ax1)  # qiskit 3d

    Line(ax1, PO, PB_2)
    # Line(ax1, PO, PA_2)
    Line(ax1, PA_2, PB_2)

    # lables(psi)
    ax1.text(0.35, 0, 0.8, r"$\vert\psi\rangle$")
    ax1.text(0.05, 0, 0.4, r"$\theta$")
    ax1.text(-0.1, 0, -0.45, r"$\phi$")

    # curves: theta and phi
    theta_max = np.pi / 6  # angle between psi and z axis
    phi_max = np.pi / 3    # angle between psi and x axis
    phi_offset = -np.pi / 2  # xy coordinate rotation from matplotlib to qiskit
    curve_radius = 0.3
    n = 20

    c1 = np.linspace(0, theta_max, n)
    x1 = curve_radius * np.sin(c1) * np.cos(phi_max+phi_offset)
    y1 = curve_radius * np.sin(c1) * np.sin(phi_max+phi_offset)
    z1 = curve_radius * np.cos(c1)
    ax1.plot(x1, y1, z1, 'g', lw=2)  # curve theta

    c2 = np.linspace(phi_offset, phi_max+phi_offset, n)
    x2 = curve_radius * np.cos(c2)
    y2 = curve_radius * np.sin(c2)
    z2 = c2 * 0
    ax1.plot(x2, y2, z2, 'r', lw=2)  # curve phi

    ax1.text(0, 0, -1.8, '(b)', fontsize=20)
    ax.set_axis_off()

    return


def Subplot_3():
    ax = plt.subplot(223)

    # string setting
    s1_1 = r'$\vert\psi\rangle$'

    s1_2 = (
        r'$=\cos\frac{\theta}{2}\ \vert0\rangle'
        r'+e^{i\phi}\sin\frac{\theta}{2}\ \vert1\rangle$'
    )

    s2 = (
        r'$=\begin{bmatrix}\cos\frac{\theta}{2}\\$'
        r'$\ e^{i\phi}\sin\frac{\theta}{2}\ \end{bmatrix}$'
    )

    s3 = r'$(0\leq\theta\leq\pi,\ 0\leq\phi<2\pi)$'

    # string output
    ax.text(0.10, 0.75, s1_1)
    ax.text(0.25, 0.75, s1_2)
    ax.text(0.25, 0.45, s2)
    ax.text(0.10, 0.15, s3)

    ax.text(0.5, -0.055, '(c)', fontsize=20)
    ax.set_axis_off()

    return


def Subplot_4():
    ax = plt.subplot(224)

    # Notation
    nttn = ['Notation',
            '',
            r'$\vert 0 \rangle$',
            r'$\vert 1 \rangle$',
            r'$\vert + \rangle$',
            r'$\vert - \rangle$',
            r'$\vert i \rangle$',
            r'$\vert -i \rangle$',
            ]

    # Description
    dctn = ['Description',
            '',
            r'$(1,0) \mapsto (0,0,1)$',
            r'$(0,1) \mapsto (0,0,-1)$',
            r'$(\frac{1}{\sqrt 2},\frac{1}{\sqrt 2}) \mapsto (1,0,0)$',
            r'$(\frac{1}{\sqrt 2},-\frac{1}{\sqrt 2}) \mapsto (-1,0,0)$',
            r'$(\frac{1}{\sqrt 2},\frac{i}{\sqrt 2}) \mapsto (0,1,0)$',
            r'$(\frac{1}{\sqrt 2},-\frac{i}{\sqrt 2}) \mapsto (0,-1,0)$',
            ]

    for i in range(8):
        ax.text(0.05, 1-0.12*i, nttn[i], color='r', fontsize=32)
        ax.text(0.40, 1-0.12*i, dctn[i], color='r', fontsize=32)

    ax.text(0.5, -0.055, '(d)', fontsize=20)
    ax.set_axis_off()

    return


# figure setting
mpl.rcParams['text.usetex'] = True
mpl.rcParams['text.latex.preamble'] = r'\usepackage{{amsmath}}'
mpl.rcParams['font.size'] = 40
fig, ax = plt.subplots(figsize=(16, 16))

Subplot_1()
Subplot_2()
Subplot_3()
Subplot_4()

# plt.savefig('/content/drive/My Drive/pqc/0029_001.png', facecolor='w')
plt.show()

解說:

-----

References


-----

Python 量子運算(目錄)

https://mandhistory.blogspot.com/2022/01/quantum-computing.html

-----

2023年2月23日 星期四

Python 量子運算(二八):投影算子

Python 量子運算(二八):投影算子

2023/02/23

-----


Fig. 28.1. Projection operator.

-----

代碼 28.1


  1
  2
  3
  4
  5
  6
  7
  8
  9
 10
 11
 12
 13
 14
 15
 16
 17
 18
 19
 20
 21
 22
 23
 24
 25
 26
 27
 28
 29
 30
 31
 32
 33
 34
 35
 36
 37
 38
 39
 40
 41
 42
 43
 44
 45
 46
 47
 48
 49
 50
 51
 52
 53
 54
 55
 56
 57
 58
 59
 60
 61
 62
 63
 64
 65
 66
 67
 68
 69
 70
 71
 72
 73
 74
 75
 76
 77
 78
 79
 80
 81
 82
 83
 84
 85
 86
 87
 88
 89
 90
 91
 92
 93
 94
 95
 96
 97
 98
 99
100
101
102
103
104
105
106
107
108
109
110
111
112
113
114
115
116
117
118
119
120
121
122
123
124
125
126
127
128
129
130
131
132
133
134
135
136
137
138
139
140
141
142
143
144
145
146
147
148
149
150
151
152
153
154
155
156
157
158
159
160
161
162
163
164
165
166
167
168
169
170
171
172
173
174
175
176
177
178
179
180
181
182
183
184
185
186
187
188
189
# Program 28.1:Projection operator
import numpy as np
import matplotlib as mpl
import matplotlib.pyplot as plt

from qiskit.visualization import plot_bloch_vector


class Point:
    def __init__(self, x, y, z):
        self.x = x
        self.y = y
        self.z = z


def Line(ax, A, B):
    ax.plot([A.x, B.x], [A.y, B.y], [A.z, B.z], 'b')
    return


def Subplot_1():
    ax = plt.subplot(221)

    s1 = (
        r'$\vert 0 \rangle \equiv $'
        r'$\begin{bmatrix} 1 \\ 0 \end{bmatrix} \mapsto (0,0,1)$'
    )

    s2 = (
        r'$\vert 1 \rangle \equiv $'
        r'$\begin{bmatrix} 0 \\ 1 \end{bmatrix} \mapsto (0,0,-1)$'
    )

    s3 = r'$\psi_x=\cos \phi \sin \theta$'
    s4 = r'$\psi_y=\sin \phi \sin \theta$'
    s5 = r'$\psi_z=\cos \theta$'

    ax.text(0.15, 0.90, s1)
    ax.text(0.15, 0.60, s2)
    ax.text(0.15, 0.30, s3)
    ax.text(0.15, 0.20, s4)
    ax.text(0.15, 0.10, s5)

    ax.text(0.5, -0.055, '(a)', fontsize=20)
    ax.set_axis_off()

    return


def Subplot_2():
    ax1 = fig.add_subplot(222, projection='3d')

    # P1 = Point(0, 0, 1)
    # plot_bloch_vector([P1.x, P1.y, P1.z], ax=ax1)
    # ax1.scatter(P1.x, P1.y, P1.z)

    # P2 = Point(0, 0, 0)
    # Line(ax1, P1, P2)

    theta = np.pi / 6
    rotation = (3/2) * np.pi  # transfer 3d to qiskit 3d
    phi_1 = np.pi / 3         # 3d
    phi_2 = rotation + phi_1  # qiskit 3d

    PO = Point(0, 0, 0)
    PB_1 = Point(np.sin(theta)*np.cos(phi_1), np.sin(theta)*np.sin(phi_1), 0)
    PB_2 = Point(np.sin(theta)*np.cos(phi_2), np.sin(theta)*np.sin(phi_2), 0)
    PA_1 = Point(PB_1.x, PB_1.y, np.cos(theta))
    PA_2 = Point(PB_2.x, PB_2.y, np.cos(theta))

    plot_bloch_vector([PA_1.x, PA_1.y, PA_1.z], ax=ax1)  # qiskit 3d

    Line(ax1, PO, PB_2)
    # Line(ax1, PO, PA_2)
    Line(ax1, PA_2, PB_2)

    # lables(psi)
    ax1.text(0.35, 0, 0.8, r"$\vert\psi\rangle$")
    ax1.text(0.05, 0, 0.4, r"$\theta$")
    ax1.text(-0.1, 0, -0.45, r"$\phi$")

    # curves: theta and phi
    theta_max = np.pi / 6  # angle between psi and z axis
    phi_max = np.pi / 3    # angle between psi and x axis
    phi_offset = -np.pi / 2  # xy coordinate rotation from matplotlib to qiskit
    curve_radius = 0.3
    n = 20

    c1 = np.linspace(0, theta_max, n)
    x1 = curve_radius * np.sin(c1) * np.cos(phi_max+phi_offset)
    y1 = curve_radius * np.sin(c1) * np.sin(phi_max+phi_offset)
    z1 = curve_radius * np.cos(c1)
    ax1.plot(x1, y1, z1, 'g', lw=2)  # curve theta

    c2 = np.linspace(phi_offset, phi_max+phi_offset, n)
    x2 = curve_radius * np.cos(c2)
    y2 = curve_radius * np.sin(c2)
    z2 = c2 * 0
    ax1.plot(x2, y2, z2, 'r', lw=2)  # curve phi

    ax1.text(0, 0, -1.8, '(b)', fontsize=20)
    ax.set_axis_off()

    return


def Subplot_3():
    ax = plt.subplot(223)

    # string setting
    s1_1 = r'$\vert\psi\rangle$'

    s1_2 = (
        r'$=\cos\frac{\theta}{2}\ \vert0\rangle'
        r'+e^{i\phi}\sin\frac{\theta}{2}\ \vert1\rangle$'
    )

    s2 = (
        r'$=\begin{bmatrix}\cos\frac{\theta}{2}\\$'
        r'$\ e^{i\phi}\sin\frac{\theta}{2}\ \end{bmatrix}$'
    )

    s3 = r'$(0\leq\theta\leq\pi,\ 0\leq\phi<2\pi)$'

    # string output
    ax.text(0.10, 0.75, s1_1)
    ax.text(0.25, 0.75, s1_2)
    ax.text(0.25, 0.45, s2)
    ax.text(0.10, 0.15, s3)

    ax.text(0.5, -0.055, '(c)', fontsize=20)
    ax.set_axis_off()

    return


def Subplot_4():
    ax = plt.subplot(224)

    # string setting
    s1 = r'$P = \vert \psi \rangle \langle \psi \vert $'

    s2 = (
        r'$=\ $'
        r'$\begin{bmatrix}$'
        r'$\cos^2 \frac{\theta}{2} & $'
        r'$e^{-i\phi} \sin{\frac{\theta}{2}} \cos{\frac{\theta}{2}}\\$'
        r'$e^{i\phi} \sin{\frac{\theta}{2}} \cos{\frac{\theta}{2}} &$'
        r'$\sin^2 \frac{\theta}{2}$'
        r'$\end{bmatrix}$'
    )

    s3 = (
        r'$=\ \frac{1}{2}$'
        r'$\begin{bmatrix}$'
        r'$1+\psi_z & \psi_x-i\psi_y \\$'
        r'$\psi_x+i\psi_y & 1-\psi_z$'
        r'$\end{bmatrix},$'
    )

    s4 = (
        r'$where\ P_{ij}(i,j=0,1) = \langle i \vert P \vert j \rangle .$'
    )

    # string output
    ax.text(0.10, 0.90, s1, color='r')
    ax.text(0.10, 0.65, s2, color='r', fontsize=32)
    ax.text(0.10, 0.35, s3, color='r')
    ax.text(0.10, 0.10, s4, color='r', fontsize=32)

    ax.text(0.5, -0.055, '(d)', fontsize=20)
    ax.set_axis_off()

    return


# figure setting
mpl.rcParams['text.usetex'] = True
mpl.rcParams['text.latex.preamble'] = r'\usepackage{{amsmath}}'
mpl.rcParams['font.size'] = 40
fig, ax = plt.subplots(figsize=(16, 16))

Subplot_1()
Subplot_2()
Subplot_3()
Subplot_4()

# plt.savefig('/content/drive/My Drive/pqc/0028_001.png')
plt.show()

解說:

-----

References


[1] Projection Operators and Completeness

https://quantummechanics.ucsd.edu/ph130a/130_notes/node185.html


[2] linear algebra - What is the idea behind a projection operator? What does it do? - Mathematics Stack Exchange

https://math.stackexchange.com/questions/1303977/what-is-the-idea-behind-a-projection-operator-what-does-it-do


[3] 黃子嘉 - 線代離散研究室: [線性代數] 請教4個的觀念

http://zjhwang.blogspot.com/2009/07/4.html


[4] 特殊矩陣 (5):冪等矩陣 | 線代啟示錄

https://ccjou.wordpress.com/2009/09/29/%E7%89%B9%E6%AE%8A%E7%9F%A9%E9%99%A3-%E4%BA%94%EF%BC%9A%E5%86%AA%E7%AD%89%E7%9F%A9%E9%99%A3/

-----

Python 量子運算(目錄)

https://mandhistory.blogspot.com/2022/01/quantum-computing.html

-----

2023年2月22日 星期三

Python 量子運算(二七):三維直角坐標系

Python 量子運算(二七):三維直角坐標系

2023/03/22

-----


Fig. 27.1. Three dimensional Cartesian coordinate system.

-----

代碼 27.1


  1
  2
  3
  4
  5
  6
  7
  8
  9
 10
 11
 12
 13
 14
 15
 16
 17
 18
 19
 20
 21
 22
 23
 24
 25
 26
 27
 28
 29
 30
 31
 32
 33
 34
 35
 36
 37
 38
 39
 40
 41
 42
 43
 44
 45
 46
 47
 48
 49
 50
 51
 52
 53
 54
 55
 56
 57
 58
 59
 60
 61
 62
 63
 64
 65
 66
 67
 68
 69
 70
 71
 72
 73
 74
 75
 76
 77
 78
 79
 80
 81
 82
 83
 84
 85
 86
 87
 88
 89
 90
 91
 92
 93
 94
 95
 96
 97
 98
 99
100
101
102
103
104
105
106
107
108
109
110
111
112
113
114
115
116
117
118
119
120
121
122
123
124
125
126
127
128
129
130
131
132
133
134
135
136
137
138
139
140
141
142
143
144
145
146
147
148
149
150
151
152
153
154
155
156
157
158
159
160
161
162
163
164
165
166
167
168
169
170
# Program 27.1:Three dimensional Cartesian coordinate system
import numpy as np
import matplotlib as mpl
import matplotlib.pyplot as plt

from qiskit.visualization import plot_bloch_vector


class Point:
    def __init__(self, x, y, z):
        self.x = x
        self.y = y
        self.z = z


def Line(ax, A, B):
    ax.plot([A.x, B.x], [A.y, B.y], [A.z, B.z], 'b')
    return


def Subplot_1():
    ax = plt.subplot(221)

    s1 = (
        r'$\vert 0 \rangle \equiv $'
        r'$\begin{bmatrix} 1 \\ 0 \end{bmatrix} \mapsto (0,0,1)$'
    )

    s2 = (
        r'$\vert 1 \rangle \equiv $'
        r'$\begin{bmatrix} 0 \\ 1 \end{bmatrix} \mapsto (0,0,-1)$'
    )

    s3 = r'$\psi_x=\cos \phi \sin \theta$'
    s4 = r'$\psi_y=\sin \phi \sin \theta$'
    s5 = r'$\psi_z=\cos \theta$'

    ax.text(0.15, 0.90, s1)
    ax.text(0.15, 0.60, s2)
    ax.text(0.15, 0.30, s3, color='r')
    ax.text(0.15, 0.20, s4, color='r')
    ax.text(0.15, 0.10, s5, color='r')

    ax.text(0.5, -0.055, '(a)', fontsize=20)
    ax.set_axis_off()

    return


def Subplot_2():
    ax1 = fig.add_subplot(222, projection='3d')

    # P1 = Point(0, 0, 1)
    # plot_bloch_vector([P1.x, P1.y, P1.z], ax=ax1)
    # ax1.scatter(P1.x, P1.y, P1.z)

    # P2 = Point(0, 0, 0)
    # Line(ax1, P1, P2)

    theta = np.pi / 6
    rotation = (3/2) * np.pi  # transfer 3d to qiskit 3d
    phi_1 = np.pi / 3         # 3d
    phi_2 = rotation + phi_1  # qiskit 3d

    PO = Point(0, 0, 0)
    PB_1 = Point(np.sin(theta)*np.cos(phi_1), np.sin(theta)*np.sin(phi_1), 0)
    PB_2 = Point(np.sin(theta)*np.cos(phi_2), np.sin(theta)*np.sin(phi_2), 0)
    PA_1 = Point(PB_1.x, PB_1.y, np.cos(theta))
    PA_2 = Point(PB_2.x, PB_2.y, np.cos(theta))

    plot_bloch_vector([PA_1.x, PA_1.y, PA_1.z], ax=ax1)  # qiskit 3d

    Line(ax1, PO, PB_2)
    # Line(ax1, PO, PA_2)
    Line(ax1, PA_2, PB_2)

    # lables(psi)
    ax1.text(0.35, 0, 0.8, r"$\vert\psi\rangle$")
    ax1.text(0.05, 0, 0.4, r"$\theta$")
    ax1.text(-0.1, 0, -0.45, r"$\phi$")

    # curves: theta and phi
    theta_max = np.pi / 6  # angle between psi and z axis
    phi_max = np.pi / 3    # angle between psi and x axis
    phi_offset = -np.pi / 2  # xy coordinate rotation from matplotlib to qiskit
    curve_radius = 0.3
    n = 20

    c1 = np.linspace(0, theta_max, n)
    x1 = curve_radius * np.sin(c1) * np.cos(phi_max+phi_offset)
    y1 = curve_radius * np.sin(c1) * np.sin(phi_max+phi_offset)
    z1 = curve_radius * np.cos(c1)
    ax1.plot(x1, y1, z1, 'g', lw=2)  # curve theta

    c2 = np.linspace(phi_offset, phi_max+phi_offset, n)
    x2 = curve_radius * np.cos(c2)
    y2 = curve_radius * np.sin(c2)
    z2 = c2 * 0
    ax1.plot(x2, y2, z2, 'r', lw=2)  # curve phi

    ax1.text(0, 0, -1.8, '(b)', fontsize=20)
    ax.set_axis_off()

    return


def Subplot_3():
    ax = plt.subplot(223)

    # string setting
    s1_1 = r'$\vert\psi\rangle$'

    s1_2 = (
        r'$=\cos\frac{\theta}{2}\ \vert0\rangle'
        r'+e^{i\phi}\sin\frac{\theta}{2}\ \vert1\rangle$'
    )

    s2 = (
        r'$=\begin{bmatrix}\cos\frac{\theta}{2}\\$'
        r'$\ e^{i\phi}\sin\frac{\theta}{2}\ \end{bmatrix}$'
    )

    s3 = r'$(0\leq\theta\leq\pi,\ 0\leq\phi<2\pi)$'

    # string output
    ax.text(0.10, 0.75, s1_1)
    ax.text(0.25, 0.75, s1_2)
    ax.text(0.25, 0.45, s2)
    ax.text(0.10, 0.15, s3)

    ax.text(0.5, -0.055, '(c)', fontsize=20)
    ax.set_axis_off()

    return


def Subplot_4():
    ax = plt.subplot(224)

    # string setting
    s1 = (
        r'$\vert \psi \rangle =\ $'
        r'$\begin{bmatrix}$'
        r'$\sqrt \frac{1+\psi_z}{2} \\$'
        r'$\frac{\psi_x+i\psi_y}{\sqrt{2(1+\psi_z)}}$'
        r'$\end{bmatrix}$'
    )

    # string output
    ax.text(0.10, 0.45, s1, color='r', fontsize=70)  # equation 1

    ax.text(0.5, -0.055, '(d)', fontsize=20)
    ax.set_axis_off()

    return


# figure setting
mpl.rcParams['text.usetex'] = True
mpl.rcParams['text.latex.preamble'] = r'\usepackage{{amsmath}}'
mpl.rcParams['font.size'] = 40
fig, ax = plt.subplots(figsize=(16, 16))

Subplot_1()
Subplot_2()
Subplot_3()
Subplot_4()

# plt.savefig('/content/drive/My Drive/pqc/0027_001.png')
plt.show()


解說:

-----

References


-----

Python 量子運算(目錄)

https://mandhistory.blogspot.com/2022/01/quantum-computing.html

-----