Python 量子運算(一七):差角
2023/02/01
-----
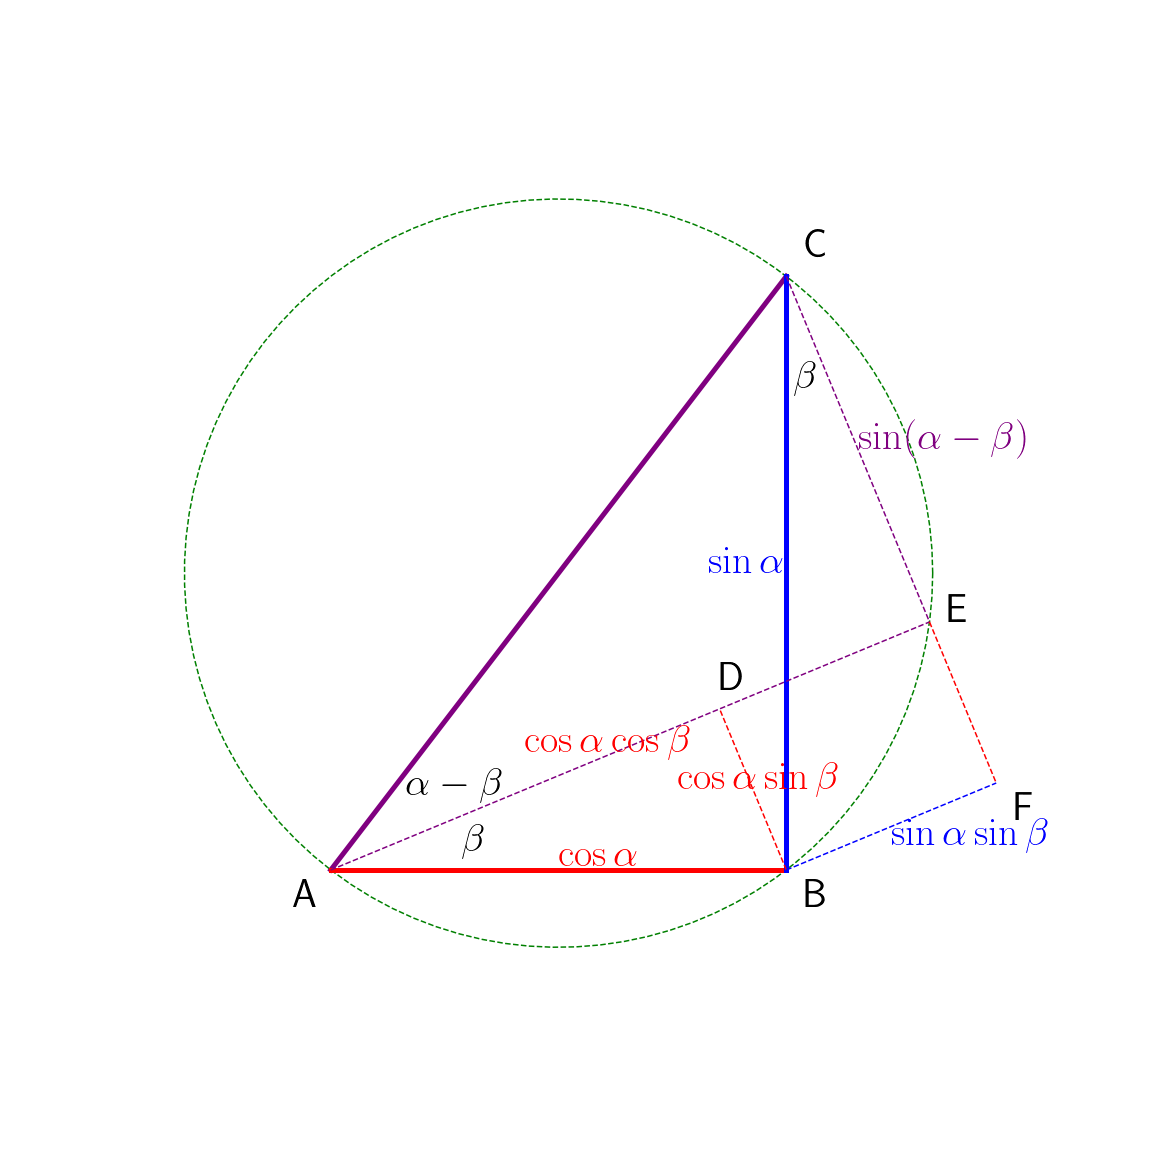
Fig. 17. 1 Angle difference.
-----
代碼 17.1
1 2 3 4 5 6 7 8 9 10 11 12 13 14 15 16 17 18 19 20 21 22 23 24 25 26 27 28 29 30 31 32 33 34 35 36 37 38 39 40 41 42 43 44 45 46 47 48 49 50 51 52 53 54 55 56 57 58 59 60 61 62 63 64 65 66 67 68 69 70 71 72 73 74 75 76 77 78 79 80 81 82 83 84 85 86 87 88 89 90 91 92 93 94 95 96 97 98 99 100 101 102 103 104 105 106 107 108 109 110 111 112 113 114 115 116 117 118 119 120 121 122 123 124 125 | # Program 17.1:Angle difference import numpy as np import matplotlib as mpl import matplotlib.pyplot as plt # defined by angle class PointT1: def __init__(self, t, r): self.t = t # theta self.r = r # radius self.x = r * np.cos(t) self.y = r * np.sin(t) # defined by points class PointT2: def __init__(self, x, y): self.x = x self.y = y def Subplot_1(): ax = plt.subplot(111) # circle c = np.linspace(0, np.pi*2, 100) r = 1 c_x = r * np.cos(c) c_y = r * np.sin(c) ax.plot(c_x, c_y, 'g', linestyle='--') t_A = (31/24) * np.pi # theta A setting PA = PointT1(t_A, r) # A PC = PointT1(t_A-np.pi, r) # C, determined by A ax.plot([PA.x, PC.x], [PA.y, PC.y]) # AC ax.plot([PA.x, PC.x], [PA.y, PC.y], 'purple', linewidth=5.0) # AC ax.text(PA.x-0.1, PA.y-0.1, 'A') ax.text(PC.x+0.05, PC.y+0.05, 'C') PB = PointT2(PC.x, PA.y) # B, determined by A, C ax.plot([PA.x, PB.x], [PA.y, PA.y]) # AB ax.plot([PB.x, PB.x], [PB.y, PC.y]) # BC ax.plot([PA.x, PB.x], [PA.y, PA.y], 'r', linewidth=5.0) # AB ax.plot([PB.x, PB.x], [PB.y, PC.y], 'b', linewidth=5.0) # BC ax.text(PB.x+0.05, PB.y-0.1, 'B') t_E = (47/24) * np.pi # theta E setting PE = PointT1(t_E, r) # E ax.plot([PA.x, PE.x], [PA.y, PE.y], 'purple', linestyle='--') # AE ax.plot([PC.x, PE.x], [PC.y, PE.y], 'purple', linestyle='--') # CE ax.text(PE.x+0.05, PE.y, 'E') # finding Point G for learning slope_AE = (PE.y - PA.y) / (PE.x - PA.x) # PG_x = PB.x # PG_y = (PG_x - PA.x) * slope_AE + PA.y # PG = PointT2(PG_x, PG_y) # ax.plot([PB.x, PG.x], [PB.y, PG.y], 'k') # BG # finding Point D slope_CE = (PE.y - PC.y) / (PE.x - PC.x) # -(1/slope_AE) slope_BD = slope_CE # (PD_y - PA.y) / (PD_x - PA.x) = slope_AE # (PD_y - PB.y) / (PD_x - PB.x) = slope_BD # (PD_y) = slope_AE * (PD_x - PA.x) + PA.y # (PD_y) = slope_BD * (PD_x - PB.x) + PB.y # slope_AE * (PD_x - PA.x) + PA.y = slope_BD * (PD_x - PB.x) + PB.y x1 = (slope_AE * PA.x - slope_BD * PB.x + PB.y - PA.y) x2 = (slope_AE - slope_BD) PD_x = x1 / x2 # PH = PointT2(PD_x, PA.y) # for verifying PD_x # ax.plot([PB.x, PH.x], [PB.y, PH.y], 'k') # for verifying PD_x PD_y = slope_AE * (PD_x - PA.x) + PA.y PD = PointT2(PD_x, PD_y) ax.plot([PB.x, PD.x], [PB.y, PD.y], 'r', linestyle='--') # BD ax.text(PD.x, PD.y+0.05, 'D') # finding Point F PF_x = PE.x - PD.x + PB.x PF_y = PE.y - PD.y + PB.y PF = PointT2(PF_x, PF_y) ax.plot([PB.x, PF.x], [PB.y, PF.y], 'b', linestyle='--') # BF ax.plot([PE.x, PF.x], [PE.y, PF.y], 'r', linestyle='--') # EF ax.text(PF.x+0.05, PF.y-0.1, 'F') # angles ax.text(PA.x+0.20, PA.y+0.20, r'$\alpha-\beta$') ax.text(PA.x+0.35, PA.y+0.05, r'$\beta$') ax.text(PC.x+0.02, PC.y-0.30, r'$\beta$') # edges ax.text((PA.x+PB.x)/2, (PA.y+PB.y)/2+0.01, r'$\cos\alpha$', color='r') ax.text((PA.x+PD.x)/2, (PA.y+PD.y)/2+0.10, r'$\cos\alpha\cos\beta$', color='r') ax.text((PB.x+PD.x)/2-0.20, (PB.y+PD.y)/2, r'$\cos\alpha\sin\beta$', color='r') ax.text((PB.x+PC.x)/2-0.21, (PB.y+PC.y)/2, r'$\sin\alpha$', color='b') ax.text((PB.x+PF.x)/2, (PB.y+PF.y)/2-0.05, r'$\sin\alpha\sin\beta$', color='b') ax.text((PC.x+PE.x)/2, (PC.y+PE.y)/2, r'$\sin(\alpha-\beta)$', color='purple') ax.set_aspect(1) # height : width ax.set_axis_off() return mpl.rcParams['text.usetex'] = True mpl.rcParams['text.latex.preamble'] = r'\usepackage{{amsmath}}' mpl.rcParams['font.size'] = 40 fig = plt.figure(figsize=(16, 16)) Subplot_1() # plt.savefig('/content/drive/My Drive/pqc/0017_001.png') plt.show() |
解說:
-----
沒有留言:
張貼留言
注意:只有此網誌的成員可以留言。